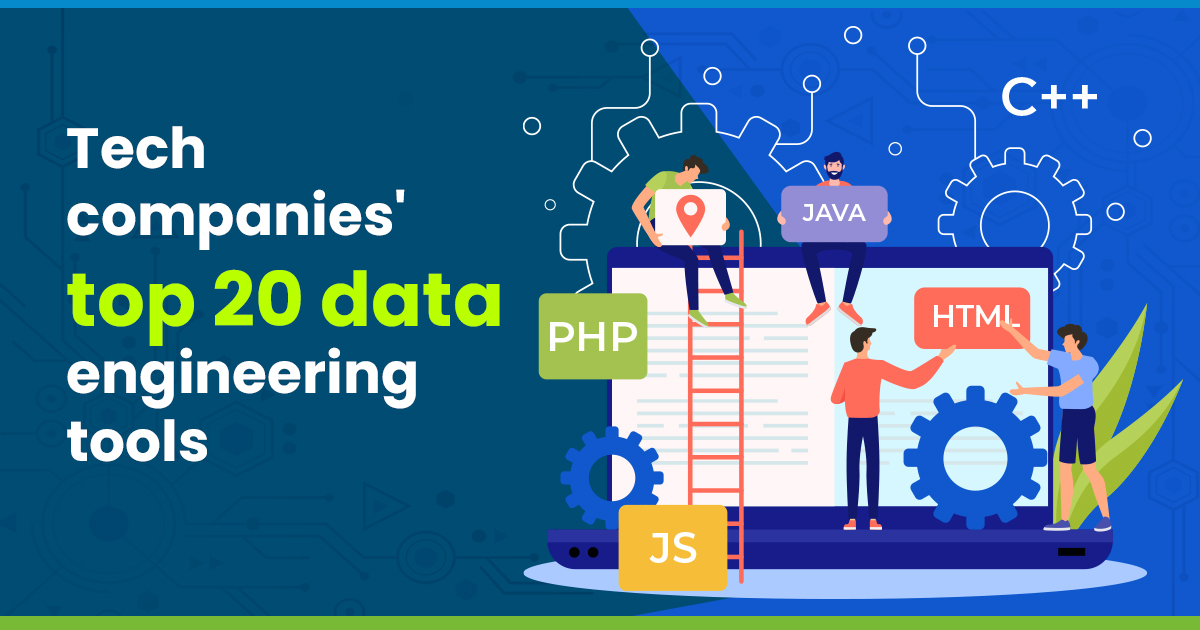
Tech Companies’ Top 20 Data Engineering Tools
The demand for data engineers surged tremendously due to the sudden influx of operational data into our analytics stack. Data engineers construct data pipelines, which are essentially infrastructure designs that support current data analytics, in order to facilitate seamless analytics. To construct data pipelines, the needs of data engineers are classified into distinct categories of requirements. Data engineering tools, which include a variety of programming languages and data warehouses but are not limited to data management, BI, processing, and analytics tools, are used to satisfy these needs.
This blog post will focus on the necessity of data engineering tools and their significance. In addition, we will provide a list of the top data engineering tools for constructing an appropriate data architecture to enable flawless business operations.
What Do Data Engineering Tools Consist Of?
Data Engineering Technologies is an umbrella phrase used to define the tools that make up the modern data stack. A modern data stack requires specific technologies that reduce the amount of time required for data integration by engineers. These connectors are cloud-agnostic, user-centric, and scalable to suit your expanding data requirements. In general, data engineering tools help in:
- Building a data pipeline.
- Facilitating streamlined ETL/ELT procedures.
- Reporting on business intelligence and data visualization.
- Let’s explore them briefly, providing some examples and relative weights.
Data Integration: Fully managed ETL solutions are required to offer real-time or near-real-time data availability for business monitoring. Fivetran, Hevo Data, Xplenty, and many others are examples.
Cloud-based data warehouses are next in the list for two reasons: First, it represents an improvement over on-premise legacy databases. Second, an agile data warehouse solution is ideal for modern corporate operations due to its scalability on the go and off-the-shelf deployment. Amazon Redshift, Google BigQuery, Snowflake, and many others are examples.
Transformation of data is essential since it enables effective data analytics. Typically, transformation involves the conversion of data from one format to another. Examples include Adeptia, Hevo Data, and Boomi, among others.
Data Visualization / Business Intelligence: Business intelligence technologies provide access to information. BI solutions can assist firms in making data-driven decisions to avoid operational risk and maximize operations enabling efficiency. There are numerous examples, like Power BI, Tableau, and Looker.
SnowFlake
Snowflake, a supplier of cloud-based data storage and analytics, is a warehouse-as-a-service designed to meet the needs of modern organizations. It deserves credit for creating, perfecting, and resurrecting the data warehouse sector. It expedites the transition to a cloud-based solution. Snowflake has managed infrastructure, on-demand scalability, intelligent clustering, and simple interface with ODBC, JDBC, Javascript, Python, Spark, R, and Node.js.
Snowflake’s unique architecture combines the advantages of shared-disk and shared-nothing architectures; its novel design fully exploits the cloud. Using MPP (massively parallel processing) compute clusters, the central data repository of Snowflake has access to data stored on compute nodes while it executes queries. Each node locally stores a piece of the total data collection. Snowflake’s architecture consists of three layers: Database Store, Query Processing, and Cloud Services.
Redshift
This data engineering solution is a petabyte-scale data warehouse developed for data scientists, data analysts, data administrators, and software developers. Its parallel processing and compression methods let users conduct actions on billions of rows, hence lowering command execution time by a large margin. Redshift is ideal for analyzing massive amounts of data using modern business intelligence tools in many data warehouses.
The architecture of Amazon Redshift is built on an extended communication channel between the client application and the data warehouse cluster. These two communicate via JDBC and ODBC drivers for PostgreSQL, which are industry standards. The key infrastructure components of Redshift’s architecture are the leader node, computation node, and node slices of the Data warehouse cluster.
BigQuery
This is an enterprise-grade data engineering solution warehouse for analytics that is fully managed and serverless. It enables data analysts and data scientists of today to efficiently evaluate data by constructing a logical data warehouse in columnar storage and collecting data from object storage and spreadsheets. BigQuery ML, Big Query GIS, BigQuery BI Engine, and linked sheets are its primary features.
BigQuery is a potent tool for democratizing insights, driving business choices, conducting analytics, and analyzing petabyte-scale SQL queries. Built on Dremel technology, Bigquery offers a serverless design. It has decoupled data locality and different clusters for storage and processing.
It differentiates from cloud-based systems based on nodes. Utilizing technologies like Borg, Colossus, Jupiter, and Dremel, it achieves optimal performance.
Python
Python is a popular, object-oriented, high-level programming language used to create websites and software. In addition to task automation, data analysis, and data visualization, Python has several applications. Python is reasonably simple to use and master; hence, accountants, scientists, data professionals, and others have adopted it for a variety of activities, such as arranging finances and objectifying 3D representations of scientific hypotheses.
Due to the rapid language acceptance by data analysts and other professionals, Python is now regarded as an indispensable data engineering tool for conducting difficult statistical estimations, creating data visualizations, and developing machine learning algorithms, among other data-related jobs. Programmers fall in love with the language because it allows them to create a vast array of complicated analytical functions, such as data visualizations, such as line and bar graphs, pie charts, histograms, and 3D plots.
Fivetran
Fivetran, similar to Hevo, is a managed data pipeline platform. Fivetran generally standardizes the process of replicating schemas from the source of your choosing to destinations such as Redshift, BigQuery, and others. Fivetran uses the ELT methodology to load data into a data warehouse, meaning that loading occurs prior to transformation. By simplifying the process of developing SaaS connectors, the product offering helps save valuable man-hours.
SQL
SQL (Structured Query Language), which was developed in the early 1970s, is a standard programming language. SQL is used to manage and extract data and/or information from relational databases. Today, not only database administrators but also software developers must be proficient with SQL. SQL is mostly used to construct “data integration scripts” and execute analytical queries in order to convert and utilize data for business intelligence.
Microsoft Power BI
This is a Business Intelligence and Data Visualization tool, is used in analytical use cases to visualize data in a manner that is more business-friendly by transforming data sets into live data dashboards and analysis reports. Power BI’s cloud-based services with an intuitive user interface are a boon for non-technical users seeking to create reports and dashboards without difficulty.
Power Bi enables hybrid deployment, which is usually used to collect data from many sources in order to provide reports that will inform your next business decision. The Power BI application suite includes the following components: Power BI API, Power BI Desktop, Power BI Service, Power BI Report Server, Power BI Marketplace, PowerBi Mobile Apps, Power BI Gateway, and Power BI Embedded.
Tableau
This data engineering tool is described by researchers as a “very interactive and intuitive visual exploration experience allowing business users to effortlessly access, arrange, and analyze their data without the need for coding.”
Tableau is a data visualization and Business Intelligence solution used for business applications such as data modeling, building live dashboards, and assembling data reports to empower business teams to make decisions based on data.
The product’s accessibility and usability make it popular among technical and business teams. Tableau is capable of producing a variety of charts, plots, and graphs. Its unique graph patterns can be carefully positioned for data visualization in PowerPoint presentations and weekly progress reports. Tableau is capable of working with both structured and unstructured data sets. In addition, Tableau is user-friendly and does not require technical or programming expertise.
Apache Hive
Hive is a data warehouse software project built on Apache Hadoop for data processing and querying. Hive provides a SQL-like interface for querying data stored in Hadoop-integrated databases and filesystems. Hive is utilized for three main functions: data summarization, data analysis, and data querying. HiveQL is the query language that is supported solely by Hive. This language transforms SQL-like queries into Hadoop-deployable MapReduce tasks.
Conclusion
Contact us there are numerous additional data engineering tools available, leaving data engineers spoiled for choice. While these tools aid data engineers in constructing an effective data information infrastructure, they are not without their own advantages and disadvantages. Data engineers are tasked with identifying the optimal data tools for their organizations while controlling the technologies’ downsides. The ultimate objective is to construct a durable stack that can operate for months or years with minimum modification.

Have Any Question?
- (832) 861-1004
- hr@dataqinc.com